Generation Objective Function Objective Function Cost Components Value
| Production Costs | Distribution Costs | Baeklogging Costs | ||
| 3362735.46 | 1535734.35 | 1785087.53 | 41913.59 | |
| 3518056.29 | 1585712.71 | 1885604.83 | 46738.76 | |
| 3432194.00 | 1570540.31 | 1816000.42 | 45653.27 | |
| 3322349.64 | 1342030.76 | 1933676.20 | 46642.68 | |
| 3332406.08 | 1395911.51 | 1890112.39 | 46382.18 | |
| 3269328.90 | 1339857.54 | 1884197.35 | 45274.01 | |
| 3300088.48 | 1279846.07 | 1972214.67 | 48027.74 | |
| 3413263.23 | 1353061.36 | 2010694.26 | 49507.61 | |
| 3237457.66 | 1182422.41 | 2003883.03 | 51152.22 | |
| 3438569.33 | 1337718.85 | 2050300.23 | 50550.26 | |
| 3335353.62 | 1317070.94 | 1964474.69 | 53807.99 | |
| 3232867.64 | 1279079.26 | 1904696.90 | 49091.49 | |
| 3113441.80 | 1143276.59 | 1921706.87 | 48458.34 | |
| 3325795.10 | 1266882.61 | 2010020.71 | 48891.78 | |
| 3239138.49 | 1188170.25 | 2002909.63 | 48058.61 | |
| 3356759.78 | 1271412.43 | 2031592.60 | 53754.75 | |
| 3383898.14 | 1301476.02 | 2031889.50 | 50532.62 | |
| 3310228.58 | 1262840.23 | 1998644.31 | 48744.05 | |
| 3231536.32 | 1236590.42 | 1945626.04 | 49319.87 | |
| 3175533.05 | 1215303.27 | 1912822.28 | 47407.50 | |
| 3224699.33 | 1157885.90 | 2017513.73 | 49299.71 | |
| 3259193.36 | 1224197.47 | 1984848.84 | 50147.06 | |
| 3309834.29 | 1200427.46 | 2057050.37 | 52356.47 | |
| 3204893.68 | 1222135.88 | 1931309.80 | 51448.01 | |
| 3219992.61 | 1227578.66 | 1945790.49 | 46623.47 | |
| 3092748.56 | 1056950.94 | 1987857.14 | 47940.48 | |
| 3017958.97 | 1040282.48 | 1931422.03 | 46254.46 | |
| 3118698.65 | 1049077.61 | 2022842.91 | 46778.13 | |
| 3200044.66 | 1129250.06 | 2022542.90 | 48251.70 | |
| 3207720.89 | 1139170.30 | 2018833.82 | 49716.77 | |
| 3063926.54 | 994753.07 | 2023145.36 | 46028.12 | |
| 3185100.62 | 1097770.99 | 2040909.97 | 46419.66 |
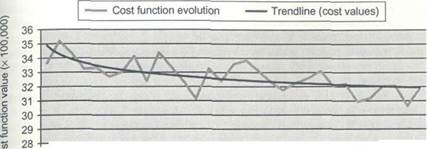
fitness function values and their cost components) recorded at the intervals of 50 iterations.
The evolution of the average fitness function values is graphically illustrated Ш Figure 18.3, demonstrating the reasonable convergence speed of the GA model. The proposed model converges to optimality consistently with a typical reduction in overall logistics costs of more than 10% (optimal cost of $3,017,958.97 at
 1 1 1 1 1 1—I—I—I 1—r
о 1 100 200 300 400 500 600 700 800 900 100011001200130014001500
Generations
Figure 18.3 The evolution of fitness function (average values) in 1500 iterations.
1 1 1 1 1 1—I—I—I 1—r
о 1 100 200 300 400 500 600 700 800 900 100011001200130014001500
Generations
Figure 18.3 The evolution of fitness function (average values) in 1500 iterations.
|
generation 1262 compared to the original cost of $3,362,735.46 at generation 1). In another attempt, the model was run with the stopping condition of the model set to terminate the process when the difference between the overall SC costs in 10 consecutive generations becomes less than $1. The results of this experiment indicate that optimal results are typically achieved after 3200 iterations with only minimal difference in fitness function value compared to what we achieved in generation 1262 from the first experiment (i.e., about 1 1% reduction in overall logistics costs at generations 3224—3234 compared to just more than 10% in the first experiment at generation 1262).
In a nutshell, the results achieved from these experiments reveal that the proposed optimization model in this chapter yields significant cost-reduction benefits within acceptable model runtime through the global integration of activities across a logistics network.