D. Economic models omit many details to allow us to see what is truly important.
55. A circular-flow diagram is
a. a model that illustrates cost-benefit analysis.
b. a model that explains how the economy is organized.
c. a model that shows the flow of traffic in an economic region.
d. a model that explains how banks circulate money in the economy.
ANSWER: b. a model that explains how the economy is organized.
56. Factors of production are
a. inputs into the production process.
b. weather, social, and political conditions that affect production.
c. the physical relationships between economic inputs and outputs.
d. the mathematical calculations firms make to determine production.
ANSWER: a. inputs into the production process.
57. The two loops in the circular-flow diagram represent
a. the flow of goods and the flow of services.
b. the flow of goods and services and the flow of dollars.
c. the flow of dollars and the flow of financial assets.
d. the flow of capital goods and the flow of consumer goods.
ANSWER: b. the flow of goods and services and the flow of dollars.
58. The revenue from sales that firms have left after paying for the factors of production is
a. rent.
b. wages.
c. interest.
d. profit.
ANSWER: d. profit.
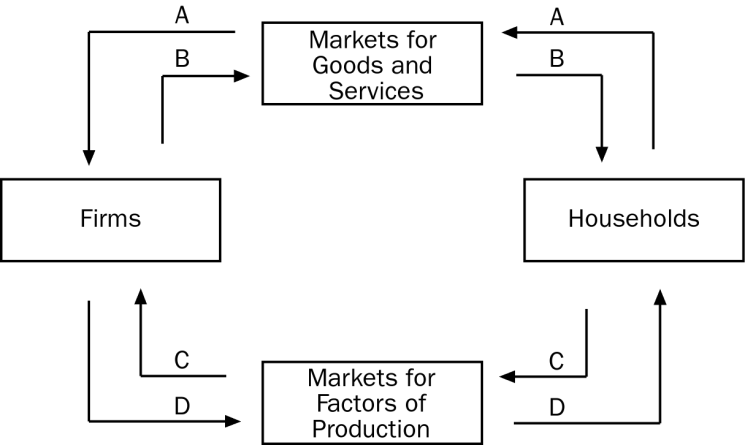
59. In the circular-flow diagram shown, which arrow shows the flow of goods and services?
a. A
b. B
c. C
d. D
ANSWER: b. B
60. In the circular-flow diagram shown, which arrow shows the flow of spending by households?
a. A
b. B
c. C
d. D
ANSWER: a. A
61. In the circular-flow diagram shown, which arrow shows the flow of the factors of production?
a. A
b. B
c. C
d. D
ANSWER: c. C
62. In the circular-flow diagram shown, which arrow shows the flow of income payments?
a. A
b. B
c. C
d. D
ANSWER: d. D
63. The production possibilities frontier is
a. a map which shows the frontier beyond which agriculture is unprofitable.
b. a map which shows areas of the world in which capitalist production is now possible.
c. a graph that shows the various combinations of output the economy can possibly produce given the available resources and technology.
d. a graph which shows the various combinations of resources that can be used to produce a given level of output.
ANSWER: c.
64. An economic outcome is said to be efficient if
a. the economy is using all of the resources it has available.
b. the economy is conserving on resources and not using all it has.
c. the economy is getting all it can from the scarce resources it has available.
d. the economy is producing only the goods and services consumers need the most.
ANSWER: c. the economy is getting all it can from the scarce resources it has available.
65. Which of the following concepts is NOT illustrated by the production possibilities frontier?
a. efficiency
b. opportunity cost
c. equity
d. tradeoffs
ANSWER: c. equity

66. On the production possibilities frontier shown, which point or points are possible for this economy to produce?
a. A, B, C, D
b. A, B, C, F
c. A, B, C, D, E, F
d. D
ANSWER: a. A, B, C, D
67. On the production possibilities frontier shown, which point represents the maximum possible production of CD s?
a. A
b. B
c. C
d. D
ANSWER: a.
68. On the production possibilities frontier shown, which point or points are NOT possible for this economy to produce?
a. D
b. E, F
c. A, B, C
d. D, E, F
ANSWER: b. E, F
69. On the production possibilities frontier shown, which point or points are efficient?
a. A, B, C
b. A, C, F
c. E
d. D
ANSWER: a. A, B, C
70. On the production possibilities frontier shown, which point or points are inefficient?
a. A, B, C
b. E, F
c. B
d. D
ANSWER: d. D

71. In the production possibilities frontier shown, what is the opportunity cost to society of the movement from point D to point B?
a. 750 pretzels
b. 500 pretzels
c. 250 pretzels
d. 150 pretzels
ANSWER: c. 250 pretzels
72. In the production possibilities frontier shown, what is the opportunity cost to society of moving from point C to point E?
a. 150 pretzels
b. 300 potato chips
c. a and b
d. zero
ANSWER: c. a and b
73. For economists, statements about the world are of two types:
a. assumptions and theories.
b. true statements and false statements.
c. specific statements and general statements.
d. positive statements and normative statements.
ANSWER: d. positive statements and normative statements.
74. For economists, positive statements are
a. descriptive, making a claim about how the world is.
b. optimistic, putting the best possible interpretation on things.
c. affirmative, justifying existing economic policy.
d. prescriptive, making a claim about how the world ought to be.
ANSWER: a. descriptive, making a claim about how the world is.
75. Normative statements are
a. descriptive, making a claim about how the world is.
b. statements about the normal condition of the world.
c. prescriptive, making a claim about how the world ought to be.
d. statements which establish production goals for the economy.
ANSWER: c. prescriptive, making a claim about how the world ought to be.
76. Production Possibilities for Tuneland
Cars Toys
50 0
40 250
30 450
20 600
10 700
0 750
77. The reference table shows the production possibilities for Tuneland. What is the opportunity cost to Tuneland of increasing the production of cars from 30 to 40?
a. 200 toys
b. 250 toys
c. 450 toys
d. It is impossible to tell what the opportunity cost is without knowing production costs for cars and toys.
ANSWER: a. 200 toys
78. In the table showing the production possibilities for Tuneland, what is the opportunity cost of increasing the production of toys from 450 to 600?
a. 30 cars
b. 20 cars
c. 10 cars
d. It is impossible to tell what the opportunity cost is without knowing production costs for cars and toys.
ANSWER: c. 10 cars
79. Based on the table showing the production possibilities for Tuneland, what is the most accurate statement about the opportunity cost of producing an additional 10 cars in Tuneland?
a. The opportunity cost of an additional 10 cars is 100 toys.
b. The opportunity cost of an additional 10 cars is 200 toys.
c. It is impossible to determine the opportunity cost of an additional 10 cars.
d. The opportunity cost of an additional 10 cars increases as more cars are produced.
ANSWER: d. The opportunity cost of an additional 10 cars increases as more cars are produced.